Sector KPI Benchmarking: Semiconductors
A peer-benchmarking analysis across 15 S&P 500 semiconductor companies, ranking firms on profitability and valuation rather than headline market cap.
40.9%Avg. EBITDA margin, sector
46.3xAvg. P/E, sector
66.7%Of companies pay a dividend
1.6%Avg. dividend yield, sector
Overview
Built a peer-benchmarking framework for the S&P 500's semiconductor sector, combining profitability (EBITDA margin), valuation (P/E, price-to-book), and dividend policy into a single composite score — the kind of comparative view a corporate strategy or investor-relations team uses to see where a company stands against its direct peers, not just the index.
Method
- Python-based pipeline on S&P 500 constituent financials, filtered to the Semiconductors sub-industry (15 companies)
- Derived implied revenue and EBITDA margin from reported EBITDA and price-to-sales ratios, backing out revenue where it wasn't reported directly
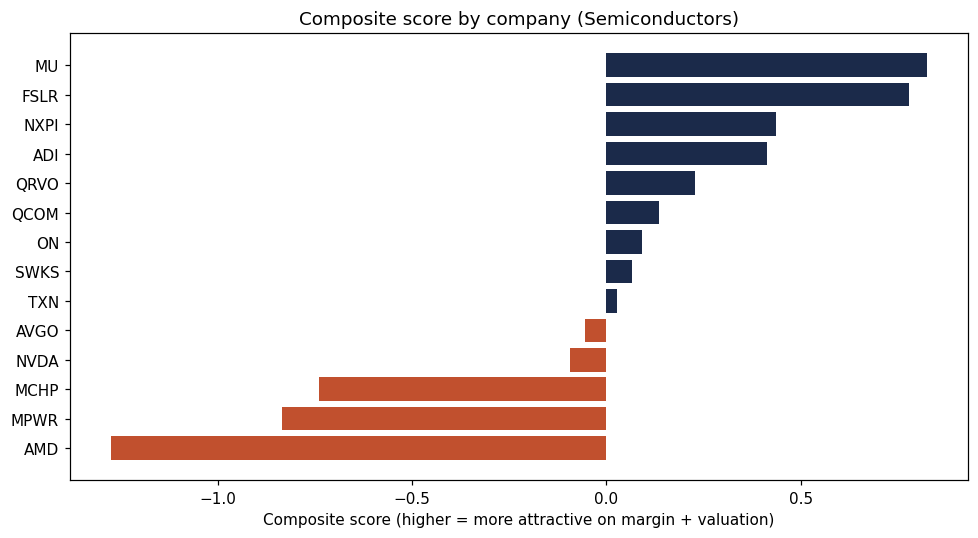
- Built a composite ranking score (z-scored EBITDA margin, inverted P/E, inverted price-to-book) so the ranking rewards profitability and reasonable valuation, not just size
Results
| Company | P/E | EBITDA Margin | Price/Book | Composite Score |
|---|---|---|---|---|
| Micron Technology (MU) | 23.0x | 75.6% | 11.4 | 0.83 |
| First Solar (FSLR) | 12.6x | 44.4% | 2.1 | 0.78 |
| NXP Semiconductors (NXPI) | 19.5x | 38.4% | 5.0 | 0.44 |
| Analog Devices (ADI) | 43.1x | 49.9% | 5.2 | 0.41 |
| Qorvo (QRVO) | 23.9x | 24.3% | 2.6 | 0.23 |
| … | ||||
| Broadcom (AVGO) | 45.6x | 58.4% | 17.1 | −0.06 |
| Nvidia (NVDA) | 29.2x | 66.4% | 24.3 | −0.09 |
| Microchip Technology (MCHP) | 109.1x | 29.4% | 6.2 | −0.74 |
| Monolithic Power Systems (MPWR) | 74.6x | 30.6% | 15.4 | −0.84 |
| Advanced Micro Devices (AMD) | 121.8x | 23.1% | 11.6 | −1.28 |
Key Findings
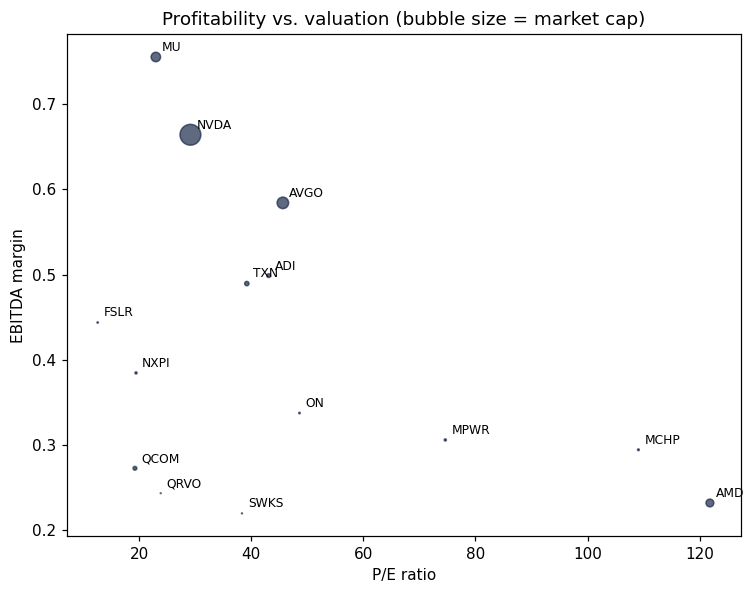
- Sector-wide average EBITDA margin is 40.9% (median 36.1%), against an average P/E of 46.3x — high margins, but also priced at a substantial premium to earnings across the group
- Micron Technology ranks #1 on the composite score: a 75.6% EBITDA margin at a comparatively modest 23x P/E, standing out from peers trading at much richer multiples for similar or lower margins
- Only 66.7% of sector constituents pay a dividend at all, and the average yield across the sector is just 1.6% — capital is overwhelmingly being reinvested rather than distributed
- The two lowest-ranked companies on the composite score (AMD, Monolithic Power Systems) combine sub-31% EBITDA margins with P/E ratios above 74x — the clearest gap in this peer set between valuation and underlying profitability
Deliverable
Full analysis delivered as a Jupyter notebook with the ranked comparison table, methodology for the composite score, and supporting charts.