Customer Churn & Retention: A Predictive Risk Model
A predictive churn model on 7,000+ telecom subscriber records, quantifying revenue at risk and identifying the highest-leverage retention actions.
26.5%Baseline churn rate
$139K/moRecurring revenue at risk
0.845Random forest AUC
~50%Of churners caught in top 20% risk
Overview
Built a predictive churn model on a 7,043-customer telecom subscriber base to flag at-risk accounts before they cancel, then translated the model's output into a monthly revenue-at-risk figure and a prioritized retention list — the kind of deliverable a subscription or membership business would hand straight to its retention team.
Method
- Python-based data pipeline: cleaning, encoding, and a stratified 75/25 train/test split
- Logistic regression (interpretable baseline) and random forest (nonlinear comparison), both evaluated on accuracy, precision, recall, and AUC
- Risk-scored the full customer base and ranked by predicted churn probability to test how much revenue a targeted campaign could realistically protect
Results
| Model | Accuracy | Precision | Recall | F1 | AUC |
|---|---|---|---|---|---|
| Logistic Regression | 75.0% | 51.9% | 79.7% | 0.628 | 0.846 |
| Random Forest | 75.5% | 52.4% | 80.7% | 0.636 | 0.845 |
Key Findings
- Baseline churn rate of 26.5% represents roughly $139K/month ($1.67M annualized) in recurring revenue at risk
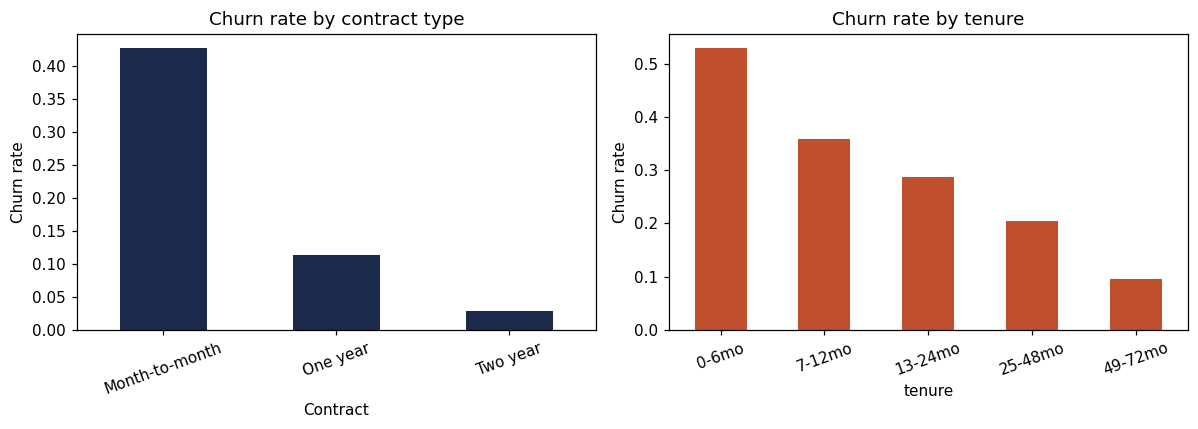
- Contract type is the dominant lever: month-to-month customers churn at 42.7% vs. 11.3% (one-year) and 2.8% (two-year contracts)
- New customers are the highest-risk group: 52.9% churn in the first 6 months, falling to 9.5% after 4+ years of tenure
- Targeting just the riskiest 20% of customers captures about half of all churners — roughly $18K/month in revenue a retention team could focus on instead of blanket outreach
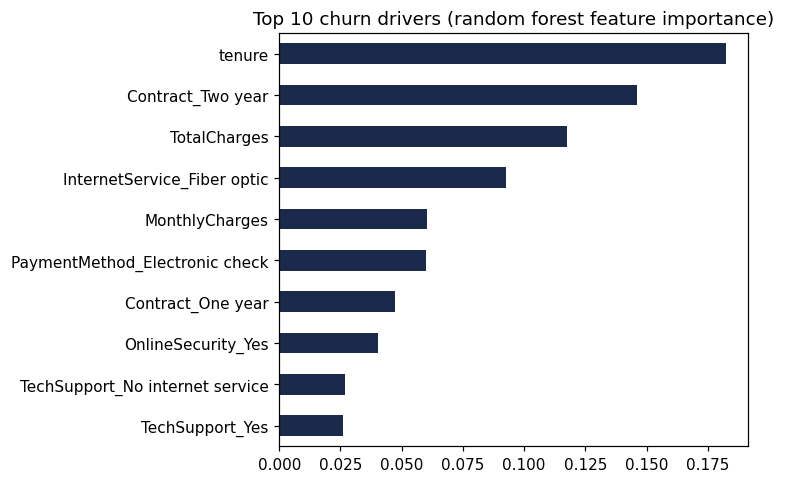
- Fiber-optic subscribers churn at more than double the rate of DSL subscribers (41.9% vs. 19.0%), pointing to a service-quality or pricing friction point worth investigating independent of the model
Deliverable
Full analysis delivered as a Jupyter notebook — data pipeline, model comparison, driver analysis, and a prioritized customer risk list — with embedded outputs and charts.